Test for freezing point: Difference between revisions
JeffEvarts (talk | contribs) No edit summary |
JeffEvarts (talk | contribs) |
||
| (2 intermediate revisions by the same user not shown) | |||
| Line 10: | Line 10: | ||
* A thermometer capable of reading temperatures both above and below the material's freezing point | * A thermometer capable of reading temperatures both above and below the material's freezing point | ||
==Execution== | ==Execution== | ||
# Immerse the thermometer in the material and place the material in the refrigerating unit. | |||
# Record the temperature as a function of time | |||
# Graph the data | |||
# The first plateau in the temperature indicates the freezing point of the material. | |||
==Example== | ==Example== | ||
[[File:WFP-TOT.png|right|320px]] | [[File:WFP-TOT.png|right|320px]] | ||
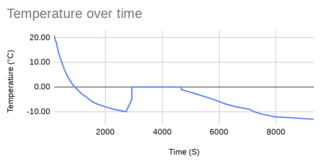
This graph shows a test for the freezing point of water. The curve at the | This graph shows a test for the freezing point of water. The curve at the right shows an initial cooling of the water sample well below 0°C, down to -16°C. Then follows a sustained temperature of 0°C for some time as the water solidifies. Finally there is another decrease in temperature as the ice's temperature falls toward the ambient temperature in the refrigerator. | ||
==See Also== | ==See Also== | ||
| Line 18: | Line 23: | ||
==References== | ==References== | ||
<references/> | <references/> | ||
[[Category:Tests]] | [[Category:Chemical Tests]] | ||
Latest revision as of 14:29, 27 November 2019
To establish the freezing point of a material, that material is placed in a refrigerating apparatus, and a thermometer is immersed directly in the material. Constant cooling is applied, and the temperature of the material is recorded and graphed as a function of time. The shape of the curve (specifically the plateau temperature reached) indicates the freezing point of the material being tested
Nature
Typically apure liquid in a stable environment will cool steadily and pass its freezing point while remaining liquid, transitioning into a "supercooled" state, where it remains for some time. Then as the liquid begins to solidify, the temperature will suddenly rise to exactly the freezing point, remaining there as the whole mass of the material solidifies.
Once all the material is solid, the mass will continue to drop in temperature until it reaches the ambient temperature in the refrigerating unit.
The graph will therefor appear as two segments of monotonically decreasing upwardly convex curves on either side of a period of steady temperature which is the material's freezing point
Equipment
- A refrigerating unit capable of reaching a temperature below the material's freezing point, and maintaining its environment at that temperature despite the introduction of the material and the thermometer
- A thermometer capable of reading temperatures both above and below the material's freezing point
Execution
- Immerse the thermometer in the material and place the material in the refrigerating unit.
- Record the temperature as a function of time
- Graph the data
- The first plateau in the temperature indicates the freezing point of the material.
Example
This graph shows a test for the freezing point of water. The curve at the right shows an initial cooling of the water sample well below 0°C, down to -16°C. Then follows a sustained temperature of 0°C for some time as the water solidifies. Finally there is another decrease in temperature as the ice's temperature falls toward the ambient temperature in the refrigerator.
